Your Chart of Accounts Is Costing You Decisions
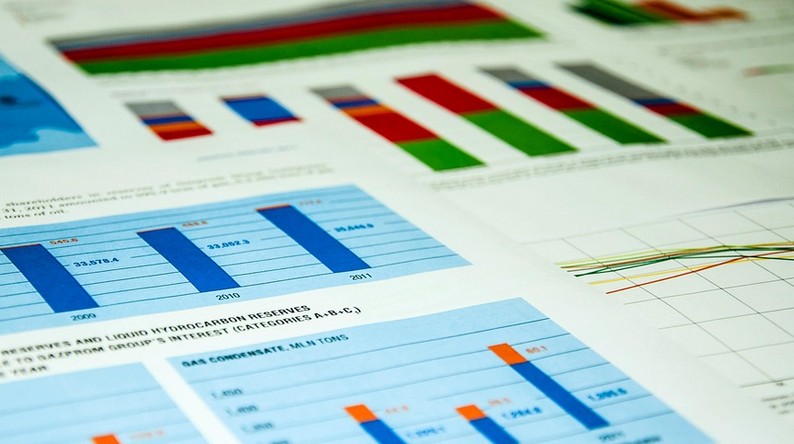
No one sets out to build a bad chart of accounts. It happens one account at a time, usually in a hurry, usually because a bill arrived that did not fit anywhere obvious.
A few years later the reports are technically correct and practically useless. There are eleven expense lines nobody can explain, three ways to book software, and a catch-all account large enough to hide a problem.
What the chart of accounts is for
The chart of accounts is not a filing system for the accountant. It is the structure that determines which questions your reports can answer.
If marketing spend sits inside "General and Administrative," you cannot see cost per lead. If contractor costs land in the same line as salaries, you cannot see true headcount cost. The chart decides what is visible.
Signs the structure is working against you
- Reports require a manual spreadsheet export to be useful
- Someone rebuilds the same summary every month outside the system
- Comparisons to last year need a mapping table
- Every new purchase prompts a debate about where to book it
- More than one account called "Other"
- Nobody can name the ten largest expense accounts without looking
When the structure is right, reporting is mostly repeatable. When it is wrong, every month is a reconstruction project.
The test that matters
Pick the three decisions leadership actually makes every month: pricing, hiring, and where to spend the next dollar. Then check whether the current accounts can support each one without extra work.
If a decision needs a side spreadsheet, the chart is missing a dimension, not a report. Usually that dimension is one of these:
- Function vs nature: what the cost is for, versus what it is
- Fixed vs variable: what changes with volume
- Direct vs indirect: what is attributable to a product or customer
- Recurring vs one-time: what will repeat next month
How to rebuild without a clean-slate project
Do not attempt a full re-chart during a busy period. Start with the top of the P&L.
- Rewrite revenue so it maps to how you actually sell
- Group direct costs by delivery area
- Split payroll into the parts that behave differently
- Collapse unambiguous dead accounts into one archive line
- Add tracking dimensions only where a real decision depends on them
Bring historical data forward with a mapping table, not a rework. Two years of comparable history is worth more than a perfect structure with none.
The bottom line
A chart of accounts is infrastructure. When it is good, nobody notices. When it is bad, the whole finance function runs slower than it should.
If your reporting depends on someone's memory of where things get booked, contact Nexera Consulting. We rebuild structures that hold up as the business grows.